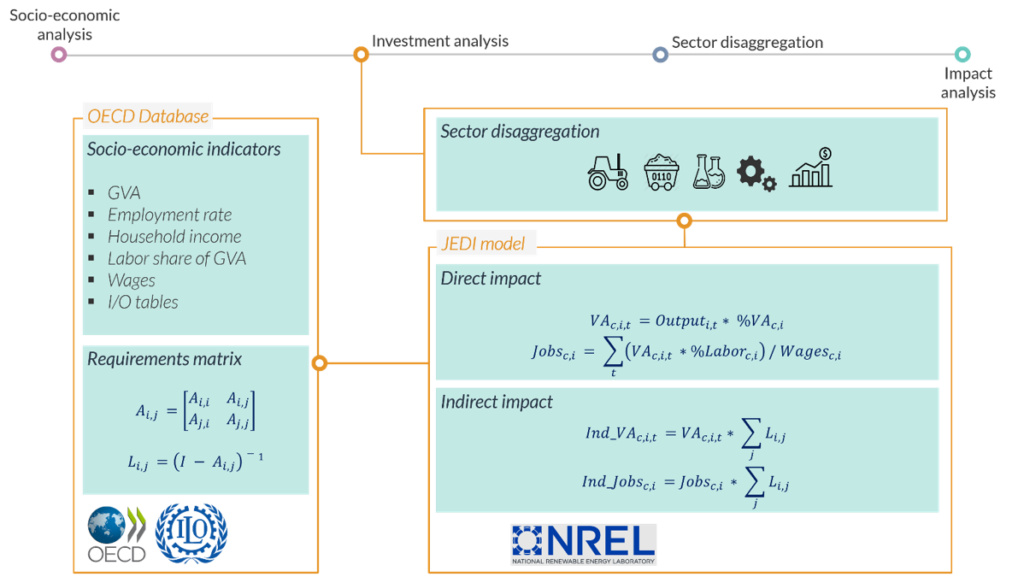
To quantify the economic impacts of a given energy project across different sectors, project data need to be specified in the model. These data include technology capital (CAPEX) and operational (OPEX) cost, project year, total capacity installed and plant capacity factor. For specific technologies (e.g. bioenergy plant) additional information might be required (e.g. type and origin of biomass sources, to derive direct impacts on the agricultural sector).
The modelling tool combines project cost data with socio-economic indicators to derive the impact of the project to different sectors of the UK economy. Impacts are expressed in terms of gross value added (GVA), the value of an industry’s production and employment creation. These metrics are distributed across direct (project expenditures) and indirect impacts (spinoff economic activity among industries that could occur as a result of these expenditures.

Value added and jobs created in a given industry are proportional to the output produced by technology in that sector. Indirect impacts are calculated using an IO methodology based on social accounting matrices that contain sales and purchases made by other sectors of the economy.
Induced
Indirect
Direct
- On site construction workers
- Equipment manufacturers
- Maintenance workers
- Replacement part workers
- Security personnel
- Equipment design workers
- Legal services
- Resource suppliers
- Construction equipment suppliers
- Accounting services
- Track drivers
- Housing
- Restaurants
- Healthcare providers
- Agriculture/food providers
- Retailers
Direct
- On site construction workers
- Equipment manufacturers
- Maintenance workers
- Replacement part workers
- Security personnel
- Equipment design workers
Indirect
- Legal services
- Resource suppliers
- Construction equipment suppliers
- Accounting services
- Track drivers
Induced
- Housing
- Restaurants
- Healthcare providers
- Agriculture/food providers
- Retailers
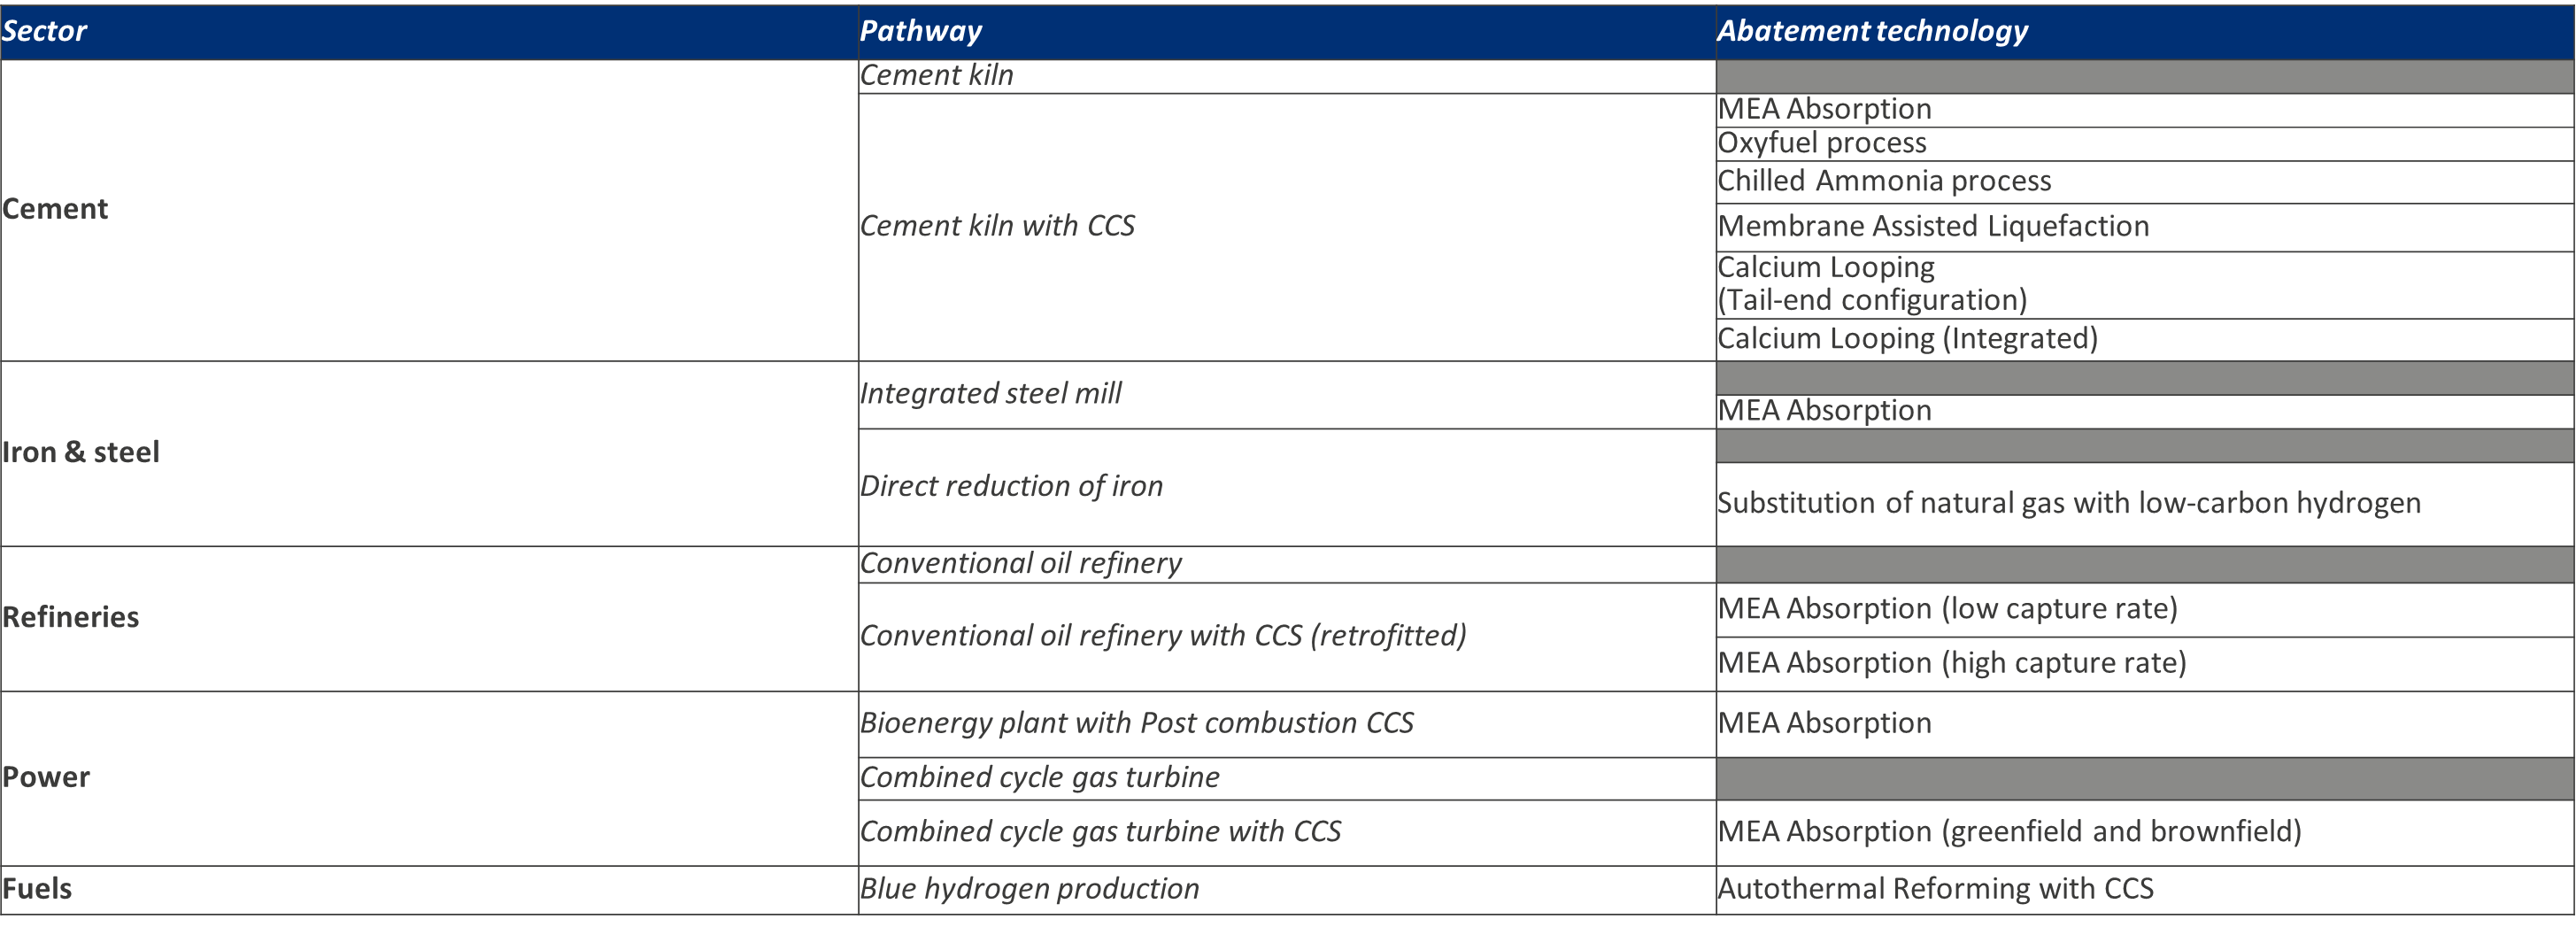
The CCS application of the tool allows the following pathways to be selected:

Limitations
The overall approach, followed by top-down models such as JEDI, is to combine the use of model plant data to estimate direct employment generation and (IO) data multipliers to estimate indirect and induced employment. While this is a well-established method of calculating the employment supported by a given project, it is not without limitations. Results should therefore be interpreted in the context of these constraints.
Most importantly, the methodology assumes that relative prices remain unchanged, and therefore that impacts making changes elsewhere in the energy sector, such as increased investment and electricity costs, cannot be determined.
UK-JEDI does not estimate constraints in resources, which can also be associated with price increases. The model assumes that all inputs, including necessary labor and investment, are available and at the same cost regardless of the quantity needed.
The IO tables are also a limiting factor, as they represent an estimate of the structure of an economy in a given year and are subject to change. Technology, relative price changes, and several other factors drive these changes. For example, the price of one input may drive a company to substitute a different input or change the location from which they purchase the input. This represents a limitation because data are often lagged for some time.
Moreover, IO tables are typically not updated every year, which may introduce errors and uncertainties resulting from overestimating the amount of employment likely to be generated by an increased demand. The most recent data available from the ONS website reports IO coefficients from 2019, which are very likely to change over the 2020–2030 timeframe. Although such simplification would most likely affect the employment figures, the difference may be small: a study on US agriculture sector employment pointed out that multipliers from IO tables constructed 10 years apart differ by only 2%.
Definitions
REF: Reference case – Cement produced in a cement Kiln
MEA: Cement produced in a Cement kiln with CCS using a MEA Absorption technique.
Oxy: Cement kiln with CCS using Oxyfuel process.
CAP: Cement kiln with CCS using Chilled Ammonia process (CAP).
MAL: Cement kiln with CCS using Membrane Assisted Liquefaction technique.
CaLtail: Cement kiln with CCS, using Calcium Looping (Tailed-end configuration).
Calint: Cement kiln with CCS, using Calcium Looping (Integrated).
Steel-BF-BOF: Reference case – Steel produced through the Blast Furnace-Basic Oxygen Furnace route in an integrated steel mill.
Steel-BF-BOF-CCS: Steel produced through the Blast Furnace-Basic Oxygen Furnace route with CCS using MEA Absorption technique in an integrated steel mill.
Steel_DR_EAF: Reference case – Steel produced using direct reduced iron in Electric Arc Furnace.
Steel-H-DR: Substitution of natural gas with low-carbon hydrogen for the direct reduction of iron process.
Refinery: Conventional Oil Refinery
Refinery-low-PCC-r: Conventional Oil refinery with CCS (retrofitted), using MEA absorption (low capture rate of 40%)
Refinery-HighPCC-r: Conventional Oil refinery with CCS (retrofitted), using MEA absorption (high capture rate of 82%)
BECCS: Bioenergy plant with Post Combustion CCS (MEA Absorption)
CCGT: Combined Cycle Gas Turbine.
CCGT_PostCCS-n and CCGT_PostCCS-r: Combined Cycle gas turbine with CCCS using MEA Absorption (greenfield and brownfield)
ATR-H2: Blue Hydrogen production using Autothermal Reforming (ATR) with CCS.
Get started...
Want to realize the macroeconomic benefits of implementing CCUS in an industrial facility? Start modelling the potential impacts now.
